Posted on

Why Street Trees are so Essential for our Cities
Posted in Akron, Dorwart, Top Story
and
Jun 12, 2018
Street trees are often taken for granted and overlooked. But in Akron, Ohio, they’re a mainstay of the urban landscape. Named a 2015 Tree City USA by the Arbor Day Foundation, Akron received the designation due to its commitment to urban forest management, led in part by City Arborist Bill Hahn.
In 2015 alone, the city planted over 2,000 trees and over 3,000 seedlings, in addition to pruning nearly 3,500. And every Arbor Day in Akron, thousands of saplings are distributed to locals by nonprofits and even MadTree Brewing Company (living up to its name).
In fact, the city of Akron, Ohio, is home to over 55,000 street trees. And if you want to know where to find the very best ones, just ask Leah Heiser, the Flowerscape director at the 37-year-old organization Keep Akron Beautiful—a nonprofit whose mission, Heiser says, is “to enhance the quality of lives in Akron through beautification, conservation education, and removing litter and graffiti.” Through the Flowerscape program, Heiser manages and cares for 32 public gardens throughout Akron.
Street trees aren’t just attractive, they also provide a myriad of benefits for our neighborhoods and cities.
Her favorites are the variety of trees in Alexander Park, the 60-year-old maple tree on West Market Street near the Keep Akron Beautiful office, and the London planetrees on High Street across from the Akron municipal building. London planetrees, Heiser says, are ideal and commonly used for city streets: “It looks exactly like a sycamore tree,” she explains, “but requires half as much water, and it’s extremely sturdy.”
To some, street trees might seem like an attractive but ultimately unnecessary urban feature. When we walk our streets, many of us—especially those of us lucky enough to live in places splashed with green and lined with flowers—probably take urban trees as a given. Whether they hang over our heads as we bike along the sidewalks or line the edges of pocket parks, trees aren’t usually given much attention or respect.
But ample research indicates that that’s a mistake, as Sarah Kobos wrote last year in “The Magic of Tree-Lined Streets.” Street trees provide plenty of pragmatic benefits in terms of urban planning and environmental wellness, such as shade from heat and relief from humidity, making streets more walkable and bikable and lowering the average electricity bills of surrounding households. They also lower the average driving speed, making roadways safer for pedestrians and drivers alike. There’s even evidence that they improve the health of nearby residents, lower crime rates, and drastically increase property values in an area.
Heiser adds that street trees are essential to a city’s environmental health. They improve air quality and decrease the circulation of greenhouse gases like carbon dioxide and ozone. “They’re extremely important,” she says of urban trees. “They help beautify the city, help reduce urban heat, help reduce stormwater runoff, clean the air, all those really wonderful functions.”
Horticultural variety, says Heiser, is essential to ensure when selecting trees for urban streets. “You want to stay away from monoculture and promote variety in order to prevent infestations,” she explains. And though this factor isn’t as essential to her personally, she notes that cities generally look for low maintenance trees that don’t require much water or consistent upkeep.
Tree selection also has to be based on the specifics of a particular urban environment. “My overall goal,” Heiser says, “is creating healthy ecosystems that have longevity, rather than instant gratification. I’m focused on creating multifunctional green spaces that are not only beautiful for the community, but also serve as wildlife habitats and food sources for local wildlife.” When planning tree planting in Akron, Heiser looks for gingkos, pears, birches, white pin oaks, river birches, and “native trees that support local wildlife. They grow so well in our environment, without a lot of leaf litter.”
As for Heiser’s plans for the landscaping in Akron, she hopes to add more trees to the Flowerscape sites and to increase the overall variety of trees Akron has to offer. “We want to create more fluidity in our green spaces in the downtown area,” she explains, adding: “We have lots of pocket parks, but we need more of them, and more connectedness between them.”
For Heiser, the value of trees and green spaces in urban environments goes beyond pragmatics into a philosophy of life and the rich history of the city of Akron. “Our history is based off of the canal, and we have a really cool opportunity to beautify the canal area and to link our history to our present through a green space.”
Moreover, incorporating trees into the urban environment, Heiser argues, fosters a greater respect for nature and stirs our innate instincts to connect with it. “We don’t spend a lot of time in nature anymore, so it’s hard to reconnect with it, and we don’t always know how,” she says. “We have a chance to foster that natural respect with interactive green spaces.” The humble street tree presents an opportunity to do just that.
(All photos courtesy of Leah Heiser)
Related
The Magic of Tree-Lined Streets
Whether you care about the environment, property values, public health, or your city’s bottom line, you can make your town stronger by planting trees.
Oct 30, 2017
Planting the Seed for an Urban Forest
John Thomas is a Strong Towns member who believes trees are a vital part of any urban landscape and he’s been working to get his town of Iowa City to plant more of them.
Mar 2, 2017
Laura Dorwart
Laura Dorwart has written for The New York Times, SheKnows, Bustle, Bitch, VICE, Catapult, McSweeney’s, and HuffPost, among other outlets. She has an MFA in creative nonfiction from Antioch University and was a Fletcher B. Jones Dissertation Fellow at UC San Diego. She lives in Ohio.
This essay is part of an ongoing engagement with Akron, Ohio, supported by the Knight Foundation. Learn more about it here.

Posted on

Tree Mortality in the Sierra Nevada

Tree Mortality in the Sierra Nevada
http://www.sierranevada.ca.gov/our-region/tree-mortality/tree-mortality
THE PROBLEM
California is experiencing tree die-off at an unprecedented scale, and the Sierra Nevada Region has been hit extremely hard. 129 million trees have died across the state due to drought and bark beetles since 2010, and 85 percent of those dead trees are in the Sierra.

Madera-mortality_2015-16_540x231.gif
Location in Madera County before and after tree mortality began spreading. Photos: Margarita Gordus, CA Department of Fish and Wildlife
Sierra Nevada forests and watersheds are at a critical point. Ongoing drought, a century of fire suppression, widespread tree mortality due to insect attacks and disease, and a changing climate have led to incredible changes across the Sierra Nevada Region. Even though California received record-breaking rains during the winter of 2016-2017, the effects of five consecutive years of drought, an increase in the bark beetle population, and warming temperatures have led to continued die-off. The map below shows the changes in tree mortality between 2006 and 2017. The southern Sierra was decimated by tree mortality in 2015 and 2016. Now the die-off continues to move north and to higher elevations.

TreeMortality

THE IMPACTS
Millions of dead trees can fuel larger, more damaging wildfires which can have long-term impacts on our water, air, wildlife, recreation, and climate.

WHAT IS BEING DONE?
TMTFlogo_105x105.pngCalifornia’s Tree Mortality Task Force (TMTF) is working to address immediate public health and safety risks by removing dead trees from roads, transmission lines, public recreation sites, and communities. The Sierra Nevada Conservancy is a member of the Tree Mortality Task Force and is working closely with other state, local, and federal agencies, utilities, industry representatives, and environmental stakeholders to look for long-term solutions that support healthy forests and communities.

Collectively, the TMTF has removed over one million dead trees in areas where public safety was at highest risk, but with a staggering 129 million dead trees, the work of the task force is far from over.

WHAT ELSE CAN BE DONE?
smallFires-strongerForests_325x173.gif

Overgrown forests are more susceptible to insect attack and drought because there are too many trees competing for limited water and nutrients. Reducing competition by doing more restoration, such as ecologically-sound thinning and using prescribed or managed fire, can help protect our still-green forests from future drought, insects, and disease.

The Sierra Nevada Watershed Improvement Program – a partnership between the Sierra Nevada Conservancy and the U.S. Forest Service – is working to increase the pace and scale of restoration across the Sierra Nevada Region by increasing funding, addressing policy impediments, and increasing infrastructure needed to support restoration.

Treated-vs-Untreated-LilyGap_540x180.jpg
Photos take at the Lily Gap Project in Calaveras County showing the difference in forest health between a thinned forest and an unthinned forest.
ADDITIONAL RESOURCES
Tree Mortality Fact Sheet
Tree Mortality Map Viewer
U.S. Forest Service Tree Mortality Page
CAL FIRE’s Public Outreach Page

Posted on

Lawns Are an Ecological Disaster

Lawns Are an Ecological Disaster
Friday 10:00am

Neil Tyson often conjectures that maybe aliens have concluded humans aren’t intelligent enough to contact. He’s probably referring to our capacity for war, but lawns may display our talent for fruitless carnage even better.
Americans devote 70 hours, annually, to pushing petrol-powered spinning death blades over aggressively pointless green carpets to meet an embarrassingly destructive beauty standard based on specious homogeneity. We marvel at how verdant we manage to make our overwatered, chemical-soaked, ecologically-sterile backyards. That’s just biblically, nay, God-of-War-ishly violent.
To understand the sheer inanity of devoting 40 million acres, nearly half as much land as we set aside for our biggest crops, to an inedible carpet, we need to back up—beyond the modern lawn’s origins with a real estate family peddling the “American Dream” as Whites-only cookie-cutter suburbs—to the evolution of grass.
Most plants grow from the top, according to Santa Barbara Botanic Garden Director Steve Windhager. “Grasses, on the other hand, always grow from the base,” he told Earther. From the plant’s perspective, this was a great strategy for dealing with grazers who’d randomly hit the same patch every few months. But Americans, true to form, are more gluttonous.
We mow our lawns every few weeks. This coaxes our grass into growing its roots outwards, rather than down, spawning more sprawling shoots, in hopes of enabling any one blade to avoid overzealous grazers. However, the $47.8 billion to $82 billion we spend annually on overcutting and landscaping (FYI: we spend $49.47 billion in foreign aid) effectively amounts to trying to kill the grass while offering it life support. We trap it in prepubescence—too young to reseed, racing desperately ever-outward to find reproductive refuges that doesn’t exist.
We cut ourselves equally: Thirty-five thousand people, 4,800 of which are children, are treated annually for mower-related injuries—resulting in 600 youth amputations. The Royal Statistical Society even awarded the fact that nearly eight times more Americans are killed by lawnmowers than Islamic terrorists International Statistic Of The Year.
And yet, Windhager himself participated in a study that found by switching to a mix of native grasses, reducing waterings, and eliminating fertilization, we could slow lawn growth and only need to mow around every two months.

A fungus desperately tries to break through the monoculture.Photo: Ian Sane (Flickr)
Influential native gardening writer Sara Stein perhaps best summed up the absurdity best: “Continual amputation is a critical part of lawn care. Cutting grass regularly—preventing it from reaching up and flowering — forces it to sprout still more blades, more rhizomes, more roots, to become an ever more impenetrable mat until it is what its owner has worked so hard or paid so much to have: the perfect lawn, the perfect sealant through which nothing else can grow—and the perfect antithesis of an ecological system.”
According to University of Florida ecology and conservation professor Mark Hostetler, that’s no hyperbole: Producing no seeds, nectar, or fruit, few creatures can use can use lawns as habitat. Biodiversity-wise “it’s almost like concrete,” he told Earther.
Up until the 1940s, we at least left odd flowers like clovers—which actually add nitrogen back to soil—alone. Then we figured out how to turn petrochemicals into fertilizer, Windhager said. “The new goal became to have a full monoculture.”
One study found that in urban areas, weeds were the most popular food sources for pollinators. Weeds and native plants are especially helpful for native pollinators—which contribute, even by the most conservative estimates, $3.44 billion dollars to our economy, and which are vastly more threatened than honeybees. A study conducted in southeastern Pennsylvania found that native plants also increased butterfly and bird populations in urban areas by around four and eightfold, respectively.
In exiling animals, lawns cost us, too. “Today’s children, growing up on lawns,” Stein once wrote “will not even have nostalgia to guide them, and soon the animals will be not only missing, but forgotten.”
“I’ve heard lawns compared to a biological desert. That’s really unfair, because deserts can be very diverse places.”
Native grasslands are a mix of cool-weather, shade-hugging so-called C3 grasses, and warm-weather, drought and fire-resistant C4 grasses. Of course, our baking lawns are mainly C3 grasses that grow aggressively with our life support — making some of them, like Bermuda grass, notes Windhager, virulent weeds. As they spread beyond our yards, studies are beginning to find that biodiversity declines.
But hey, turf grasses are still plants, though. Surely they do that one thing that no plant can fuck up, storing carbon?
Hostetler? “When you add everything up, [lawns are] definitely causing a lot more issue with climate change than preventing it.”
Damn.
Native grasses with deeper roots, Windhager said, likely store more carbon underground than shallow-rooted turf. According to the EPA, we use 580 million gallons of gas each year, in lawnmowers that emit as much pollution in one hour as 40 automobiles driving— accounting for roughly 10 to 18 percent of non-road gasoline emissions.
We also dump roughly 10 times more fertilizer on our lawns than on crops, notes Columbia’s Earth Institute. These fertilizers and the 67 million pounds of pesticides with which we drench our lawns ever year degrade, releasing compounds like nitrous oxide, a greenhouse gas 298 times more potent than CO2. Potential damages from agricultural fertilizer runoff alone were estimated by one study to cost $157 billion annually.
We’ve managed to make grass do the opposite of what photosynthesis is supposed to accomplish. A recent study out of Appalachian State University pegs our lawns’ carbon footprint at around 25 million tons annually.

A man records sprinklers watering the lawn of a house in Beverly Hills, California, at the height of the drought in 2015.Photo: Jae C. Hong (AP)
It gets better. All America’s farmland consumes 88.5 million acre feet of water a year. Lawns, with a fraction of the land, drink an estimated two-thirds as much. Most municipalities use 30-60 percent of drinkable water on lawns.
California is special. If you thought Trump tweets made no sense, LA, prior to the big drought, 70 percent of your water loss came courtesy of lawns. Water use throughout California seems to be rebounding to pre-drought levels. Lawns are soaked once more.
So, how can we unfuck lawns?
“First, let’s limit lawns to those areas where we actually need it,” Windhager said, referring to sporting fields and play areas.
To start, you can reduce your mowing and fertilizing. Better yet, switch to native grasses. Let them reseed themselves. Let the clover live. To avoid annoying the local Homeowner Association, make your native lawn look manicured. For example, “If you just maintain a circle of mowed area around a taller grass area, it makes it clear this was an intentional design state,” Windhager said.
In a few states, such as Texas and Florida, HOAs can’t fine you for not maintaining your lawn the stupid way, provided you do so to save water. Others, like California, offer programs that pay replace your lawn with native plants. And by switching to native plants or xeriscaping (desert-style landscaping), we could put quite the dent in the estimated 9 billion gallons of water we use on our yards every day.
Want to tell your HOA to sit on their sprinkler and spin? Many state have a more obscure program: Replace your yard with all native plants. Certify it through your local Department of Natural Resources branch as wildlife habitat. Get a property tax exemption.
For more information, search for your county Extension (departments devoted to assisting and educating people on ecological matters) or DNR office — or local chapters of native landscaping organizations, such as Wild Ones.
“I’ve heard lawns compared to a biological desert,” Windhager said. “That’s really unfair, because deserts can be very diverse places.”
Start searching now, because soon as you start mowing, you’re paying for green concrete.

Posted on

Color-Changing Lights Could Reset the Body’s Scrambled Clock

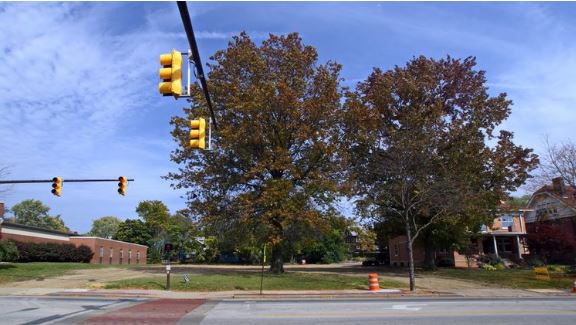
Sara Barbee uses the “Alert” setting on her tunable light system while teaching her Seattle-area kindergarteners. Annabel Clark / Undark
Reaching behind a low bookshelf slightly taller than a typical 5-year-old—and one topped with a Seattle Seahawks gnome and stuffed kangaroo—Sara Barbee presses a button labeled “Alert.” Intense, bluish light fills her classroom, and nearly all 17 kindergarteners respond with a collective “Whoooaaaaa.” Barbee, their teacher here at Renton Park Elementary School, walks back to the front of the classroom and ushers the students to sit “crisscross applesauce” on the perimeter of a brightly colored alphabet rug. Front and center rests a water tank atop a small, blue table, where Barbee teaches her students about the buoyancy of objects in water.
“Put your thinking caps on,” she beckons. “It’s a good thing we have bright lights on right now.”
Indeed, it’s not the buoyancy lesson that has drawn me to this school just outside of Seattle, but those funky new lights, which are designed to mimic the shifting colors and intensities of the rising and setting sun. Scientists believe that exposure to bright, blue-rich, white light during the day and to softer, amber hues at night helps restore the human body’s natural circadian rhythm, a deeply ingrained, physiological drumbeat that, many experts argue, has been disrupted to ill effect by our constant exposure to standard incandescent or fluorescent lighting—and more recently, to the relentless glow of electronic screens.
These are not, of course, new ideas, and doctors have long prescribed light boxes and related paraphernalia for seasonal affective disorder and other forms of depression. But it’s only now, proponents say—amid innovations in light-emitting diode, or LED, technology; amid calls for more energy-efficient lighting infrastructure overall; and amid a renaissance in scientific understanding of how human eyes, brains, and internal clocks interrelate—that a public-health revolution, driven by more thoughtful lighting infrastructure, has the potential to unfold.
If that sounds overstated to you, even pseudoscientific, you are not alone. While enthusiasm for circadian lighting, sometimes called human-centric lighting, is on the rise—in classrooms, in office buildings, in sports arenas and nursing homes—experts suggest that, at best, much more science needs to be done, and at worst, a lot of what is peddled under the guise of human-centric lighting is bunkum. James Benya, an engineer and lighting consultant based in Davis, California, goes so far as to compare some claims about circadian lighting to snake oil. “We know it is going to have a significant benefit for many people,” Benya says. “But without guiding science, and with the lack of protocols and standards, right now it is the Wild West.”
Still, there is little question that the study of human interaction with light is now in its heyday, and that the implications for our hopelessly indoor lives could be significant. Just this past October, a trio of scientists won a Nobel Prize for discerning the molecular mechanisms controlling our circadian clock—including light’s central role. Their work confirms decades of previous research suggesting that, when optimally synchronized to natural light, our internal timekeepers direct our bodies to feel hungry, sleepy, alert, or energized at appropriate times. Too little light from the blue end of the visible spectrum during the day, or too much of that same light at night, research suggests, can cause an internal clock to slip off beat, setting off a cascade of potential consequences. These include not just poor sleep, reduced concentration, and contrarian moods, but over the long term, increased risk of depression, diabetes, and cancer.
And this has proponents of advanced lighting arguing for broader adoption of such technologies sooner rather than later. We may not know everything yet, they argue, but we know enough about the benefits of circadian lighting—and the drawbacks of current lighting—to put ideas into practice. “We don’t want to overstate the benefits. But we shouldn’t dismiss them either,” says Mariana Figueiro, the director of the Lighting Research Center at Rensselaer Polytechnic Institute. “We have the technology now. It’s a shame that more people aren’t harnessing it.”
In her classroom, Barbee adjusts the lighting via a wall-mounted digital panel a few times during a typical school day. Four different presets range in intensity and in correlated color temperature—an approximation of the wavelength of the light, measured in kelvins, from 2,700 to 6,500. Lower color temperatures appear as warmer hues, like the coruscating colors of a campfire, while higher color temperatures look more like a midday blue sky—cooler and brighter. Barbee generally starts each morning with the “Alert” setting, the coolest and brightest, to help wake up the kids (and herself). She might switch to dimmer lights in orange-ish tones later in the afternoon or whenever the class could use some calming down.
Right now, under these bright, blue lights, Barbee has her students’ attention, and many of them struggle to stay seated, inching forward for a closer look at the water tank. Aydriane, Khloe, Princess, and their classmates spend the next several minutes testing hypotheses for what makes a wooden block sink. Maybe wrapping it in a rubber band? How about taping it to another wooden block? Alas, the wood won’t drop. “This is what scientists do,” Barbee assures her class.
“A lot of times they try something and it doesn’t work, but then they try again,” she adds. “That’s how we get smarter.”
________________________________________
Late last December, I met with Bret Coffman, a business process architect, at the headquarters of Vulcan, the investment and philanthropic firm headed by the Microsoft co-founder Paul Allen. Out the north-facing window of a 10th-floor common room, Coffman and I could see the Space Needle standing tall amid the buildings and cranes of this fast-growing city. To the left, the waters of the Puget Sound glistened under partly cloudy skies. To the right, about a block away, we could see a century-old local business that’s long helped illuminate this skyline: Seattle Lighting.
Coffman landed in the Emerald City 18 years ago from Colorado, one of the nation’s sunniest states. “When I first moved here, I was really unhappy,” he recalled. Two years into his job as the business process architect at Vulcan, Coffman was still struggling with sleep and focus. He needed frequent doses of caffeine to get through the work day. “Thank God there was a Starbucks downstairs,” he said.
His outlook brightened in 2014, when he was asked by company executives for assistance in investigating the potential benefits of circadian lighting. A tunable LED not unlike the ones used in Barbee’s classroom soon appeared above Coffman’s desk, and in words that would become familiar to me over the course of many months and many discussions, he repeated the circadian-lighting refrain: “I immediately started to feel better.”
Just why Coffman and so many others feel this way is something that scientists are only recently beginning to understand—and not everyone agrees on the particulars. For most of the 20th century, it was believed that rods and cones were the eye’s only photoreceptors. That all changed in the early 2000s with the discovery of a third photoreceptor. A few years earlier, researchers had shown that the circadian rhythms of mutant mice lacking rods and cones responded to light, suggesting that what meets the eye results in more than just images formed in the brain. Somewhere, a mysterious photoreceptor was responsible for the circadian system “seeing the light,” says David Berson, a neuroscientist at Brown University who helped identify the new photoreceptors and their preference for blue-spectrum light.
In much the same way as the ear allows us to both hear and stay balanced, the eye’s rods and cones supply us with vision while these novel intrinsic photosensitive retinal ganglion cells, or ipRGCs, perform a separate function: They sense the quality and quantity of light, with input from the rods and cones, and send that information to a master circadian clock in the brain. That clock then conducts a symphony of cellular timepieces throughout the body, ensuring they all “rise and fall with appropriate relationships to the others,” explains Berson.
Over millions of years, this complex system evolved with the predictable daily patterns of the sun, its illumination of the sky, and, after the eventual innovation of fire, the flicker of a campfire or candle. But the advent of electric light a little more than 150 years ago—a mere blink on the evolutionary timescale—began to move people increasingly away from those natural circadian cues. People in the developed world today spend, on average, 90 percent of the day indoors and often out of eyeshot of a window. And modern lighting turns out to be a poor proxy for daylight. The typical incandescent or fluorescent bulb, and even a standard non-tunable LED, may succeed in illuminating what we write or where we walk, but they will frequently fail to inform our physiological pacemaker that it’s daytime. And after the sun goes down, conventional lights—along with iPads, laptops, mobile phones, even certain street lights—may prevent the photoreceptor prompts needed for our clocks to properly wind down for bedtime.
It was with these basic concepts in mind that Jonathan Stine, a program manager at the Renton School District Energy Management Office, launched the pilot project that would eventually outfit Barbee’s classroom with tunable LEDs. At the time, he wasn’t aware of any school district in the United States that had adopted the technology—though that’s not entirely surprising. While the switch to LEDs usually comes with both energy savings and a cut in maintenance costs over the old fluorescent lamps, which needed to be replaced every year or two, adding the ability to tune the lights to mimic natural light usually adds at least 25 percent to the cost of LEDs. And according to the U.S. Department of Energy, they don’t provide any further energy savings over conventional LEDs. Indeed, the DOE has argued that justification for circadian lighting in schools needs to go beyond energy savings and include “benefits related to a better learning and working environment, possibly linked to student learning outcomes, teacher satisfaction and retention, and human health impacts.”
As it stands, empirical evidence of such outcomes is hard to come by, but anecdotal evidence—from Washington to Texas to Sweden—is reaching a crescendo. The winter sky in the southern Swedish city of Malmö, for example, tends to look much like that in Seattle: dull and gray. But a visitor might not know that if they were standing inside Anna Milstam’s classroom at the Lindeborg school. Milstam recalled her return after summer break in 2015, right after the new lights had been installed. “I thought we had skylights,” she said. “I want to be in that classroom as much as I can.” Her ninth-grade students echoed the sentiment. “When the sun comes up, we naturally get more happy,” said Augusta Andersson during a Skype interview in December—when the sun doesn’t rise in Malmo until nearly 9 a.m. “Now, with the lights, those positive feelings come a bit earlier.”
Louis Diep, another student, added that the lights seem to improve his focus on exams and the quality of his sleep.
Of course, these are just personal accounts, but it’s no secret to parents that teenagers can struggle to wake up in the morning for school, and they have a legitimate biological excuse: The circadian rhythm of a child naturally shifts when they reach puberty, pushing their cycle of sleep and wakefulness about two hours later than those of an average adult. Exacerbating that effect, teens may also be more sensitive than adults to disruptive blue light at night, while a lack of blue-spectrum light during the school day can further mess with middle-school students’ sleep—specifically, extending the time it takes them to fall asleep by an average of 30 minutes, according to a study co-authored by Figueiro. Research has suggested that inadequate exposure to bright blue-rich light early in the day can make both adults and children extra susceptible to the effects of blue light at night. “If you want to sit in front of your iPad in the evening,” said Figueiro, “you better get a lot of light during the day.”
Andersson, Diep, and their classmates have been in Milstam’s room for going on three years now, and as seventh graders, they participated in a master’s thesis project, the conclusions of which seem to support Figueiro’s findings. They slept slightly better than students in a classroom lit by the school’s preexisting fluorescent lights, even after accounting for differences in age, exercise, screen exposure, and classroom windows, among other variables.
Hints of positive impacts have emerged in Texas, too, where tunable LED systems have been installed in some elementary and middle-school classrooms in Carrollton, a northern suburb of Dallas. A September DOE report on the Carrollton systems suggested that the tunable LED system had improved the overall learning environment—though the DOE noted that empirically measuring the effects of the circadian lights was beyond the scope of the project. Back in Washington, entire schools—including two Renton high schools and a brand new middle school—now have circadian lighting, and initial data out of Lindbergh High School seemed to echo the findings in Texas: The school reported a double-digit rise in SAT test scores following installation of the tunable LEDs.
The emerging evidence for circadian lighting’s benefits has been enough to prompt the Washington Sustainable Schools Protocol—design guidelines for learning environments developed in collaboration with the state’s Office of Superintendent for Public Instruction—to encourage the use of tunable LED systems in the construction of new school buildings. Meanwhile, the Seattle Mariners professional baseball team became the first in the major leagues to install circadian lighting in the players’ locker room in 2013. They preset the LEDs to provide stimulating pre-game light and calming post-game light. The latter aimed to help the players rest and recover for the next nine innings—usually scheduled for the next day.
“When you’re in sports, you’re looking for every advantage you can get to improve performance,” said the team’s former facilities manager, Scott Jenkins, who is now with the Atlanta Falcons of the National Football League. He recently installed tunable LED lighting in the Falcons’ facilities, too. Other professional teams including the Portland Trail Blazers, Denver Nuggets, and New York Yankees have also followed suit. “No matter what sport you’re in, or whether you’re in a learning environment or in a health-care environment, we all know that blue sky and sunshine mean everyone is more energetic and their mood is better,” Jenkins said. “When you live in Seattle and you suffer through months at a time without any real sunshine—well, there’s a reason Starbucks does so well.”
“There are only 32 NFL teams. There are only 30 MLB teams,” added Jenkins. “But think about how many schools there are, and how many health-care facilities there are. To be able to use light to benefit people’s learning and health—there’s a huge opportunity there.”
Still, for all of its suggested promise, the impacts of tunable LED lighting on learning—or on anything else related to public health, for that matter—remain mostly speculative. Even Stine is hesitant to give full credit to the new lighting alone for Lindbergh High’s improved test performances. “There are so many factors in student achievement,” he said, adding that the classroom lighting systems would benefit from a rigorous scientific study.
Other possible benefits of circadian lighting in schools, such as improved behavior and attention, are even more difficult to gauge. “I don’t know what they would have achieved otherwise. But I have a class where all the pupils are motivated,” says Milstam in Sweden. “And it’s a different situation for many other classes in the school.” Barbee, too, recognized other factors that might influence her students’ responses, including her use of music and how she announces to her class when she switches light settings.
Experts share these teachers’ caution in making too much of the lighting just yet. “It’s thrilling for a basic biologist to see stuff translating into practical applications,” said Brown University’s Berson. “But we need to be careful not to get too far ahead of ourselves and assume we really know what a particular color of light is doing to an actual child in an actual school environment without appropriate controlled studies.”
Deborah Burnett, a lighting-consultant partner with Benya, also worries that certain lights might even have the potential to harm some students. Children don’t have the same natural defenses in their eyes as adults, she noted, expressing particular concern for when light levels rapidly and drastically change multiple times throughout the day, which is how Barbee and many other teachers currently use the lighting. In fact, Milstam’s students in Sweden initially found the quick changes in brightness and colors too jarring and distracting, which prompted school officials to program the lights to very gradually adjust over the course of the school day.
For all the uncertainty, research does suggest that blue-spectrum light may boost alertness and cognitive function, and Coffman’s environs at Vulcan Inc. bears witness to this notion in exquisite detail. Near his desk is a small conference room with bright green–painted walls. Instead of another trip to Starbucks whenever he needs a strong pick-me-up, Coffman will now often opt for what he refers to as a “blue blast”: 15 minutes of intense blue light in this room. If he’s still feeling wired at the end of the day, Coffman adds, a short orange-hued blast will put him in the mood for a beer.
Vulcan’s lighting retrofit was the first large-scale installation of tunable LEDs in a U.S. office building, according to Planled, a lighting-solutions company based outside Seattle, which consulted on the project. (They also partnered with the Renton School District.) On all six floors of the Vulcan offices, employees now spend their days under the new lights. In addition to personal computer-based controls, an employee can push a button that syncs their overhead LEDs to the day clock, much like in Milstam’s classroom.
“Your people are where most of the cost is,” says Cody Crawford, the head of facilities and operations at Vulcan. His office is down the hall, past a photo of the burning sun, from Coffman’s desk. He emphasizes the importance of educating Vulcan employees about the lights. “People in general don’t like change. They may not realize that the lack of light is making them tired and groggy,” he adds. “You almost have to force them to try it for more than an hour.”
Much like Barbee says of her kindergarteners’ responses to tunable LEDs at Renton Park, which is just a short drive south on I-5, Crawford can’t be sure how the new lighting is impacting Vulcan’s employees—or its bottom line. It’s hard to measure productivity “unless you’re a manufacturing facility,” he says. Crawford’s team had considered assessing absenteeism, but complicating factors such as high staff turnover and variations in annual flu bugs dissuaded them.
“People are happy about it,” says Crawford says of the new lighting. “How much more effort do you want to put into [measuring] it? Time is money.”
________________________________________
Steven Lockley, a circadian-lighting expert at Harvard Medical School, is among experts who have attempted to measure effects. His team found that people exposed to blue-rich light reacted faster and had fewer lapses in attention than people exposed to warmer hues. In a paper referencing his work, other researchers found blue light significantly superior to caffeine in boosting cognitive function and alertness in 21 people. Plus, light lacks the same knock-on consequences as a cup of coffee. “Caffeine at 10 a.m. will still affect your sleep at night,” says Lockley, noting the chemical’s five-to-six-hour half-life.
A report commissioned by LightingEurope, an industry trade group, calculated office productivity increases equivalent to about two more hours a month, a decrease in sick days of 1 percent and an increase in employment duration of one year as a result of tunable LED lighting. (They found greater benefits in the industrial setting.) And in a study by Figueiro’s team of daytime light exposure on office workers, employees receiving high levels of circadian-stimulating light during work hours had more stable circadian rhythms, as well as lower levels of depression and greater sleep quality, compared to employees receiving lower levels.
The employees in Figueiro’s study all wore a device calibrated to measure light exposures deemed capable of affecting the circadian system. Overall, her team found that nearly half of the workers studied did not receive enough light in the morning to adequately stimulate their internal clocks, despite nearly all of them receiving the Illumination Engineering Society’s recommended level of illuminance, 300 lux, at their desks. (For comparison, natural light is about 100,000 lux on a sunny day and 10,000 lux on a cloudy day.) Such recommendations, as well as most energy codes, are generally calculated with only visibility, safety, and energy-efficiency goals in mind. “Energy codes are getting more and more strict,” said Figueiro. “The tendency is to reduce the amount of light.” At Vulcan, for example, daylight sensors automatically reduce artificial lighting in response to available daylight, per a requirement from the City of Seattle.
Russell Foster, an expert in circadian neuroscience at the University of Oxford, pointed out that while adding bright light in the workplace will increase levels of alertness, it remains unclear how that exposure might stabilize the circadian clock compared to light exposures, say, during your commute to work or while you’re in the bathroom brushing your teeth. “It may well be that it’s too late by the time you get to work,” said Foster, whose research uncovered some of the first evidence for the third photoreceptor.
“After the ‘Wow, this is extraordinary,’ it has taken us a while to get to the applications,” he added. “We’re now at an incredibly exciting stage. The next leap forward is making this work in the real world.”
Neuroscientists, biologists, sleep doctors, and architects around the world are attempting to address the questions necessary to make that leap: Just what intensity and color of light—and when and where and for how long—best keeps our circadian clocks ticking on time? How much does this recipe vary by age, sex, and other differences between us? In search of answers, some scientists are using devices designed to measure a person’s exposure to light. Others are leveraging functional MRI technology to understand the brain’s response to light. Still other researchers are attempting to decipher more details of the complex circadian circuitry via animal models.
Much of the work continues to focus on light’s dark side. Too much light at night, underscores a December report that summarized findings of an expert panel convened by the National Toxicology Program, disrupts sleep and other biological processes controlled by our clocks. But a consensus has emerged that the problem is not just over-lighting our eyes at night, but also prevalent under-lighting during the day. Lockley, Figueiro, and Berson were among more than a dozen scientists who penned an opinion paper in 2014 arguing for the consideration of both factors in lighting design. A study in mice published in October 2017 further hinted that some of the consequences of failing to do so may be passed down through future generations.
Marty Brennan, a Seattle-based architect, is among the newer names now seeking solutions. He has developed software to help designers simulate daylight. He implemented the tool himself in recent projects at the Swedish Medical Behavioral Unit in Seattle and Children’s Hospital of Philadelphia. Meanwhile, research from Kenneth Wright of the University of Colorado at Boulder, focuses on the more intuitive aspects of the idea. In a small study of preschool children published in March, he found that an hour of bright light before bedtime nearly stopped production of the sleep-promoting hormone melatonin. Suppression continued for almost an hour after the lights went out. Wright also co-authored a 2017 study that suggested exposure to natural light during a couple nights of camping—without any electronics—can rapidly reset the body’s circadian clock.
The takeaway: While scientists still can’t beat the real thing, they might be getting better at simulating Earth’s day-and-night cycles. “Electric light does the trick,” said Brennan.
________________________________________
Mickey and Minnie Mouse smile and sway on a windowsill—the bobblehead dolls’ dance powered by rays of California sunshine. A dozen feet away, a woman sits in her wheelchair engrossed by a soap opera. She’s back in her room after winning a round of bingo, and will soon roll down the hall to lunch at the Bistro Cafe. The stretch of hallway outside her door is known in this Sacramento nursing home as Bamboo Lane. Since the ACC Care Center replaced Bamboo Lane’s fluorescent lights—which stayed on full blast day and night—with the tunable LEDs, she and other residents report that they’ve been sleeping better and experiencing improved moods. Melanie Segar, an administrator at the center, describes one resident, as having gone from being angry much of the time to being in a “happy place.”
“That’s the best we can hope for with dementia,” Segar says.
By the age of 75, science suggests that the average adult receives just 17 percent of the light needed to fully stimulate the circadian system. A yellowing lens, a narrowing pupil, cataracts, and increased time spent indoors can all conspire. To make matters worse, blue is the part of the light spectrum filtered by the eye’s aging lens. This lack of light reaching the retina can disrupt the natural fluctuations of hormones such as cortisol and melatonin, explains Dr. Scott Stringer during a visit to his office at the nursing home.
When Stringer started at the center four years ago, he began giving some residents with behavior and depression issues an unusual prescription: a couple of hours of morning sunshine. That’s generally a fillable order in a city boasting about 265 annual days with sun. “Sunshine is still the gold standard,” says Stringer. However, for a 99-bed facility, it’s not practical to get everyone a daily dose of courtyard sun. The introduction of circadian lighting at the center means Stringer’s light prescriptions are no longer limited to those he’s able to roll outside.
Research suggests that manipulating artificial light could prove a useful non-pharmacological tool to regulate the circadian rhythms of older adults, especially those suffering from dementia. The disease can damage neurons in the region of the brain that controls the circadian clock. So, if the tunable LEDs really can compensate for some of that loss, Stringer anticipates a significant impact on residents’ well-being and on health-care costs. “Hospital readmissions cost a lot of money,” says Stringer, adding that the nursing home should be a “one-time destination.”
The ACC Care Center was the focus of another DOE study, conducted after the center had installed its first tunable LEDs in a couple residents’ rooms and the adjacent corridor of Cherry Lane. In addition to energy savings of 68 percent relative to the old fluorescent system, they found that the three residents living in the two rooms had 41 percent fewer incidents of yelling, agitation, and crying during the three months following the installation compared to the preceding three months. Nursing staff also noticed that these residents began consistently sleeping through the night.
“I didn’t think much about lighting before. But I’ve become a true believer after seeing how it’s affected residents,” says Segar, as we finish touring the center. Once Cherry Lane got the tunable LEDs, she recalls, residents from other corridors began hanging out there. “And their family members began asking when they would be getting the lights too,” said Segar.
The center has now replaced the lights in all halls, common areas, resident rooms, and bathrooms as part of a broader remodel of their 30-year-old facility. Stringer is eager to study the impacts in more detail than what can be inferred from a small uncontrolled study. “We need a prospective study to see if it’s really the lighting,” he says.
That’s the other refrain I heard repeatedly over the course of the last year. While there are strong hints from research advances in cellular biology and neuroscience, some peer-reviewed studies in animals and people and a number of compelling anecdotes, much better data is needed to optimally apply circadian lighting in the real world. “We need measures of light exposure over long periods of time in a range of different settings in a larger number of subjects,” said Foster, adding that improved technologies for measuring sleep, circadian rhythms, and light exposures should make such studies doable. “Until we have that data, designing those lighting systems appropriately is going to be guesswork. We may guess correctly and it may be better than what we got. But, ideally, we should have evidence-based solutions.”
Such solutions will need to consider a host of complicating factors. Whether or not exposure to light will help or hinder someone’s rhythms comes down, primarily, to getting the right color at the right intensity at the right time and for the right length of time. But the response of each individual’s circadian system is unique, varies by age and is further influenced by other factors such as region and season. Human evolution began near the equator, where we never dealt with any significant shortening and lengthening of daylight hours. Our third photoreceptor also evolved with light coming down from the sky, meaning the angle at which light hits the eye is likely important too. What’s more, researchers are finding that exposure to blue-spectrum light may be less critical for stimulating the circadian system when the overall light exposure is high.
No standard yet exists for measuring light that affects people via the third photoreceptor. Traditional light metrics such as lux, lumens, and color temperature are based on rods and cones alone. At this point, experts can only agree with the need for a standard single metric for the circadian effectiveness of light. In their studies, the DOE used something termed the “equivalent melanopic lux.” Figueiro and her colleagues use a metric they call the “circadian stimulus.” Meanwhile, a committee of the International Commission on Illumination (CIE) is attempting to translate the scientific consensus into a first international standard. John O’Hagan, the director of the CIE’s Division on Photobiology and Photochemistry, noted that voting is underway and a final version could be published by the end of 2018.
The new standard will include information concerning the effects of age, an area of personal interest to O’Hagan. His father-in-law suffered from Alzheimer’s until his death. “I was horrified at the environment he had to live in,” recalled O’Hagan, referring to ever-present fluorescent light his father was exposed to. “I firmly believe that something can be done.”
Harvard’s Lockley added his sense of urgency to leveraging circadian lighting. Building managers have started swapping out old lights for energy-efficient LEDs, usually of the cheaper, non-tunable variety, he said. Designers of new construction are generally opting for the same. Because of the long lifespan of LEDs—much of their appeal—it could be a decade or more before those lights fade to yield another justifiable opportunity to invest in tunable LEDs. He did highlight one notable early adopter: In 2016, NASA installed tunable LEDs on the International Space Station.
“If it’s good enough for astronauts on the space station,” Lockley said, “then it’s good enough for all of us.”

Posted on

Where work pays: How does where you live matter for your earnings?

Where work pays: How does where you live matter for your earnings?

Where work pays: How does where you live matter for your earnings?
Lauren Bauer, Audrey Breitwieser, Ryan Nunn, and Jay ShambaughTuesday, July 10, 2018
Facebook
Click to share on Facebook
Twitter
Click to share on Twitter
LinkedIn
Click to share on LinkedIn
Print
Click to print
More
DOWNLOAD
Full paper
Technical appendix
Editor’s Note: An interactive tool accompanies this economic analysis, allowing users to see the distribution of annual earnings across the United States for a given occupation and age group, adjusting for cost of living and taxes.
where work pays interactive

Educational and occupational choices matter for your earnings, but where you work matters, too. Employment opportunities and wages in some occupations vary substantially from state to state, county to county, and city to city. One location might be a great place to earn a living as a nurse but not as a construction worker (e.g., New Orleans, Louisiana), while a different location might be the opposite (e.g., Utica, New York).

Does it make sense for people starting or advancing their careers to move? And if it does, to where should they move?

Authors
lauren bauer
Lauren Bauer
Fellow – Economic Studies, The Hamilton Project
@laurenlbauer
audrey breitwieser headshot
Audrey Breitwieser
Senior Research Assistant – The Hamilton Project

Ryan Nunn
Policy Director – The Hamilton Project Fellow – Economic Studies
ryan_d_nunn

Jay Shambaugh
Director – The Hamilton Project Senior Fellow – Economic Studies
@JayCShambaugh
In this economic analysis we look at some of the ways that typical earnings in an occupation—and the value of those earnings after adjusting for taxes and cost of living—vary across the United States.[1] We also examine some of the reasons why places have such different labor markets. When a place seems too good to be true (i.e., with high wages across the board and low cost of living), what could account for its seeming advantage over the rest of the country?

Economists think about these differences in terms of a worker’s choice of where to live. Evidence suggests that people often move to find work or accept a job, but that there are many other factors that play a role in where a person chooses to relocate.[2] Cost of living (including housing costs) and taxes, as well as a host of other factors collectively referred to as amenities, all contribute to a choice about where to move. Research shows that workers value amenities like pleasant weather, clean air, low crime, and proximity to cultural attractions.

Over the past few years The Hamilton Project has released interactive web tools to help workers—and particularly young adults, from college hopefuls to recent graduates—make decisions regarding their education and careers. These web tools and associated reports also help illuminate workings of the labor market and their implications for educational investments, which in turn are vital for promoting broadly shared economic growth.

In our newest interactive feature, Where Work Pays: Occupations and Earnings across the United States, users can see how typical earnings in occupations vary across metropolitan (metro) and nonmetropolitan (nonmetro) areas in the United States. They can also see how earnings by occupation change when adjusted for age, cost of living, and state and federal income taxes.[3]

LOCATION AND OCCUPATION MATTER FOR EARNINGS
The median earnings for all working-age (25–64) full-time workers in the United States is $41,000, although deviations from this value are quite large. Education plays a large role in earnings differences: workers with less than a high school education have median earnings of $23,000, while those with an advanced degree have median earnings of $73,000. Median earnings range from $15,000 to $182,000 across 320 occupation categories.[4]

Geography matters a great deal for earnings, as well. The United States can be divided into metro areas (cities and their surrounding areas) as well as state nonmetro areas (the parts of a state not included in any metro area). Together, we use the term “locations” to refer to areas included in this analysis. There are 373 metro areas included in this analysis and 47 nonmetro areas; almost every state has one nonmetro area in our calculation.[5] At the bottom of the range, median earnings are $26,000 in Sebring, Florida, while at the top of the range median earnings are $65,000 in San Jose–Sunnyvale–Santa Clara, California.

How much does location matters for earnings? After controlling for demographic differences, workers in the top 30 locations earn an average of 20 percent more than the median worker in the United States and 37 percent more than workers in the bottom 30 locations; median annual earnings are substantially higher in some locations than in others (see figure 1). Still, given the huge variation in individual earnings, location can only explain so much of individual variation. Differences in educational attainment account for 16 percent of the variation in earnings across workers, while age, race/ethnicity, sex, and occupation explain an additional 20 percent of the variation. A further adjustment for location accounts for another 1.5 percentage points of earnings variation.[6] This relatively small value does not mean that location is unimportant, just that individual characteristics mean more than regional ones.

Median Earnings for All Occupations, by Location

TYPICAL EARNINGS VARY CONSIDERABLY WITHIN OCCUPATIONS AND ACROSS LOCATIONS
There are some occupations with relatively little variation in earnings across locations, but where you work has an impact on what you earn for the vast majority of jobs. Perhaps surprisingly it is not always the location with the highest overall earnings that has the highest earnings for particular occupations. For example, while San Francisco–Oakland–Hayward, California, ranks fourth out of all locations in terms of overall median earnings, it ranks below the national median for 9 percent of occupations. Conversely, locations with low overall earnings often feature higher earnings in certain lines of work. Nineteen of the lowest 20 wage locations have at least one occupation paid at the national median or better.

Earnings differences within occupations and across locations can be quite large. For example, median earnings of computer software developers are lowest in Lubbock, Texas ($49,600) and highest in Santa Cruz–Watsonville, California ($135,000). At the other end of the earnings distribution, kitchen workers earn the least in Indianapolis–Carmel–Anderson, Indiana ($11,300) and the most in San Francisco–Oakland–Hayward, California ($25,300). Recent work by David Deming and Lisa Kahn suggests that some of this variation within occupations exists because the same occupation requires a different set of tasks and skills in different locations.

To illustrate how wages vary within a particular occupation, figure 2 presents median annual earnings for registered nurses, one of the occupations with the largest number of workers, by location. Registered nurses have the highest earnings ($101,300) in San Francisco–Oakland–Hayward, California and the lowest ($40,000) in Valdosta, Georgia. In appendix figure 1, you can see how earnings increase with age within each separate location. The interactive associated with this report allows users to input any occupation to show median earnings by location and age.

Median Earnings for Registered Nurses, by Location
PLACES WITH THE SAME OVERALL EARNINGS NONETHELESS HAVE ADVANTAGES AND DISADVANTAGES IN PARTICULAR OCCUPATIONS
How much location matters to earnings—and in which locations a person would earn more—depends on the occupation. To illustrate how earnings vary within occupations by location, for figure 3 we selected 9 of the 20 most common occupations; each vertical line represents the median earnings in that occupation in a particular place. If an occupation’s wages are more variable across locations, as with registered nurses, then where you live matters more for your wages. For occupations with less dispersion, like truck drivers, where you live matters less for your wages.

To show how earnings in occupations vary when comparing the same locations, figure 3 highlights six metro areas with median earnings that are all roughly at the level of the median location in the United States.[7] Earnings dispersion for these locations with similar overall median earnings varies widely across the occupations we selected. For example, the median primary school teacher in Riverside–San Bernardino–Ontario, California, earn $66,900 ($27,200 above the median earnings for that metro area), while primary school teachers in Wichita, Kansas; Morgantown, West Virginia; New Orleans–Metairie, Louisiana; and Jacksonville, Florida, are paid close to the median earnings for those locations. By contrast, occupations such as truck, delivery, and tractor drivers, as well as construction laborers, have a much more condensed distribution, with similar earnings across the six metro areas.

There are meaningful differences in average wages across locations, but a substantial amount of variation remains at the location-occupation level, as figure 3 helps show. It is not always the case that places rank in the same order for any given occupation. Only 6 percent of occupations have a ranking that is correlated at above 0.5 with the ranking of overall median wages. In fact, more than two-thirds of occupations have a correlation below 0.3. In part, this could be due to differences in the mix of people working in different occupations.

Distribution of Median Annual Earnings across Locations, Selected Occupations

THE VALUE OF A DOLLAR DEPENDS ON WHERE YOU LIVE
Given that a select few metro areas in the West and the Northeast have the highest wages, we might expect many more people to move to these places than already have.[8] But wages are not the only consideration for people making decisions about where they choose to live and work.

One reason that many people choose to reside and work outside high-wage locations is a lower cost of living in other parts of the country. A lower cost of living—including cheaper housing, food, education, transportation, and other goods and services—allows the same dollar of wages to stretch farther. A worker in a metro area with a relatively low cost of living (e.g., Dallas) might think twice before accepting a slightly better-paying position in a metro area with a higher cost of living (e.g., San Francisco).

Cost of living in the San Francisco metro area is not high simply because it is dense or because residents earn a high wage, however. Deliberate policy choices such as land-use restrictions have contributed to sharply rising rents and home prices, limiting the number of people who can access the economic opportunities in high-wage cities.[9] This in turn limits U.S. economic growth and allows a divergence between incomes in different places.

What does this mean for individual workers? Using the Bureau of Economic Analysis’ (BEA’s) regional price parities (RPPs), we can see just how much higher or lower the cost of the same bundle of goods and services is in each location relative to the national average cost. The RPP is calculated using prices from the Consumer Price Index and housing rents from the American Community Survey; each location’s RPP represents how much higher or lower (in percent terms) prices are in that location compared to the U.S. average.

Table 1 shows 12 locations with the same annual median earnings ($40,505) but different costs of living, giving a sense of how substantially cost of living can vary across the country. Santa Fe, New Mexico, has a cost of living index (–0.2) just slightly below the national average. By contrast, the cost of living in Auburn–Opelika, Alabama, is about 15 percent lower than the national average, while the cost of living in Atlantic City–Hammonton, New Jersey, is almost 4 percent higher. When adjusted for cost of living, $40,505 in earnings is worth $47,900 in Auburn–Opelika, Alabama, whereas in Atlantic City–Hammonton, New Jersey, that same $40,505 is worth only $39,100.

Median Annual Earnings with and without Adjustment for Cost of Living, Selected Locations

Figure 4 shows median annual earnings versus cost-of-living index by location and region.[10] Note the clear upward sloping relationship: higher-earning areas (the x-axis) tend to be those with higher cost of living (the y-axis). In fact, there are no locations with a cost of living above the national average that have earnings less than $32,000, and no locations with a cost of living below the national average that have median earnings above $50,000. For every $1,000 more in earnings the cost of living is on average 1 percentage point higher. For example, moving from a $40,000 to a $50,000 median wage location would lead to a cost-of-living index that is 10 percentage points higher, offsetting 44 percent of the increased salary. The figure also shows that metro areas in the West and Northeast tend to have higher costs of living than do metro areas in the South and Midwest. After adjusting for cost of living, locations in the Northeast and Midwest tend to feature the highest earnings.

Median Annual Earnings versus Cost-of-Living Index, by Location and Region

While income taxes do not vary as much between regions as does the cost of living, taxes are an important consideration when comparing wages across the country. It might be more difficult to interpret differences in taxes than it is to interpret differences in cost of living, however. States with high taxes spend some of their extra revenues on public goods that are valued by residents, which partially offsets the burden of income taxes. Figure 5 shows the importance of these adjustments, plotting unadjusted median annual earnings versus earnings that are adjusted for both cost of living and federal and state income taxes, by location.[11] To be clear, this figure does not provide a full picture of local tax burden, which can vary additionally through sales taxes and the relative weight of income and property taxes. Locations with high unadjusted earnings also tend to have high adjusted earnings; there is a clear upward sloping relationship in the figure. However, the relationship is not one for one: some of the higher earnings are eroded by taxes and cost of living. In other words, higher cost of living and taxes reduce—but do not eliminate—the labor market advantage of high-wage locations.

Median Annual Earnings versus Cost-of-Living- and Tax-Adjusted Earnings, by Location

HOW TO THINK ABOUT CHOICE OF LOCATION
People choosing where to live and work generally factor in their future earnings, cost of living, and taxes. However, these are not the only relevant considerations. Amenities such as temperate weather, air quality, nightlife, and cultural attractions are all nonwage benefits that differ from location to location. By knowing their own relative preferences for these amenities as well as for earnings, workers can make decisions about the best location for them.

The difficulty for researchers is that the values of amenities—unlike the value of wage earnings—cannot be directly observed. Instead, an indirect approach is used: researchers examine workers’ implicit willingness to accept lower wages and/or a higher cost of living in exchange for amenities that they value. An example of this is that many cities in the West (often those on the coast) have high costs of living relative to their median earnings (as can be seen in figure 4). This may reflect that these cities are attractive places to live, leading many people to accept slightly lower cost-of-living-adjusted wages in order to live there.

This approach to estimating amenities has proven very useful, particularly when adjustment is made for taxes and nonhousing cost of living, as has been done in a number of recent papers by economist David Albouy and others.[12] For instance, one common assertion is that postwar migration to the South occurred because of an increasing taste for sunshine and warm weather. However, work by economists Edward Glaeser and Kristina Tobio shows that this was likely not the case, given the extent to which cost-of-living-adjusted earnings have risen in that region.

Amenities are not experienced in the same way by all people. Overall, less-educated workers are less willing to pay for amenities while more-educated workers are willing to pay particularly high premiums for amenities such as restaurants and clean air, for example.

CONCLUSION
The Hamilton Project has released a series of interactives that help people see how the decisions they make help shape their earnings over time. With Major Decisions, users can input different postsecondary majors to see age-earnings profiles and lifetime earnings by major. In Putting Your Major to Work, users can input an academic major, gender, and age group to see the top occupations as well as median earnings and work status for people with that major and in those occupations. The most-recent interactive—Where Work Pays: Occupations and Earnings across the United States—allows users to select an occupation and age group and to adjust for cost of living and tax expenses to examine the distribution of earnings across the United States by metro/nonmetro areas or by state.

Educational and occupational choices matter a great deal to workers’ careers. In addition, where workers choose to live matters significantly in many occupations. As this economic analysis has shown, there is a wide range of wage outcomes across locations in the United States. Typical pay is substantially higher in some locations than in others, though the location of the highest pay varies depending on occupation. Higher pay is sometimes partially offset by higher cost of living and taxes, depending on location, but higher cost of living and taxes are balanced in some locations by nonwage amenities that attract workers. Understanding how all of these factors—earnings, cost of living, taxes, and amenities—vary across the country is necessary for a complete account of labor market outcomes.

Posted on

Nights Are Warming Faster Than Days. Here’s Why That’s Dangerous.

https://www.nytimes.com/interactive/2018/07/11/climate/summer-nights-warming-faster-than-days-dangerous.html

Nights Are Warming Faster Than
Days. Here’s Why That’s Dangerous.
By KENDRA PIERRE-LOUIS and NADJA POPOVICH JULY 11, 2018

July kicked off with searingly hot temperatures for most Americans this year.

New daily, monthly and all-time record highs were set across the country last week, with more than 100 million people sweating it out under heat warnings or advisories. But the low nighttime temperatures that usually provide a crucial respite from scorching summer days have been more quietly making history.

On July 2, Burlington, Vt., set a record for its hottest overnight temperature as the thermometer refused to budge below 80 degrees Fahrenheit. Four days later, central Los Angeles hit 95 degrees before 11 a.m., already breaking the previous daily record of 94 degrees, before rising to well over 100 in the afternoon.

More of the U.S. is Seeing Extremely Warm Temperatures at Night

Percentage of the United States in which local areas are experiencing
extreme minimum (nighttime) and maximum (daytime) summer temperatures

50% of United States area

50%

Extremely warm

nighttime lows

Extremely warm

daytime highs

40%

40%

30%

30%

20%

20%

10%

10%

1920

1940

1960

1980

2000

1920

1940

1960

1980

2000

Source: National Oceanic and Atmospheric Administration | NOAA defines extremely hot temperatures as those in the top 10 percent for the local period of record.
Nationwide, summer nights have warmed at nearly twice the rate of days, with overnight low temperatures increasing 1.4 degrees Fahrenheit per century since 1895, when national temperature records began, compared to a daytime high increase of 0.7 degrees per century. (Nights have warmed faster than days during other seasons, too.)

ADVERTISEMENT

That pattern, which is in keeping with climate change models, is expected to continue as the world warms because of human-caused carbon emissions.

Derek S. Arndt, chief of the climate monitoring division at the National Oceanic and Atmospheric Administration, called the increase in summer nighttime temperatures a “dramatic example” of how small shifts in average temperature can lead to big consequences in the extremes.

california.jpg
An early-July heatwave broke temperature records across Southern California. Mike Blake/Reuters
Warmer Summer Nights
Can ‘Really Be Lethal’
In a typical year, heat waves kill more Americans than any other natural disaster including floods, tornadoes and hurricanes.

While warm summer nights may seem less concerning than scorching afternoons, “the combination of high daytime and high nighttime temperatures can be really lethal because the body doesn’t have a chance to cool down during the nighttime hours,” said Lara Cushing, professor of environmental epidemiology at San Francisco State University.

Those risks are higher in places where temperatures have historically been cooler, like coastal California. There people are less physiologically acclimated (the body can get used to higher temperatures up to a point) and less behaviorally adapted to hot weather.

“A hundred and five degrees in San Francisco is going to have a bigger impact probably than 105 degrees in Houston, Tex., where everybody has air conditioning and people are accustomed to dealing with high temperatures,” Dr. Cushing said.

Older people, the sick, and young children are especially at risk. So are agricultural, construction and other outdoor workers, who can no longer avoid the heat by shifting their hours to work earlier or later in the day. Similarly, homeless people who bear the full brunt of the elements get little relief.

ADVERTISEMENT

In cities like Los Angeles, Asian-American, black, and Hispanic residents are more likely to live in hotter parts of the city than white residents because of a complicated range of factors like green spaces, elevation, prevailing winds and proximity to the ocean. Lack of green spaces in some neighborhoods, for example, can exacerbate the heat island effect, a phenomenon in which cities are as much as 22 degrees Fahrenheit warmer than less built-up environments because of of their impervious, heat-absorbing surfaces.

While air conditioning can provide a respite from intense heat, it isn’t a panacea. Air conditioners work by sending hot air outside, adding to the heat island effect. If fossil fuels are used to provide power for air conditioners, it exacerbates climate change. And, increased air conditioner use taxes electrical grids making power failures more likely. In the midst of the recent heatwave, roughly 90,000 Los Angeles area residents lost power because transformers, which help distribute electricity, overheated and failed.

Health officials in Canada estimated that up to 70 people in Quebec may have died from heat-related causes after last week’s heat wave stretched north.