Posted on

Nights Are Warming Faster Than Days. Here’s Why That’s Dangerous.

https://www.nytimes.com/interactive/2018/07/11/climate/summer-nights-warming-faster-than-days-dangerous.html

Nights Are Warming Faster Than
Days. Here’s Why That’s Dangerous.
By KENDRA PIERRE-LOUIS and NADJA POPOVICH JULY 11, 2018

July kicked off with searingly hot temperatures for most Americans this year.

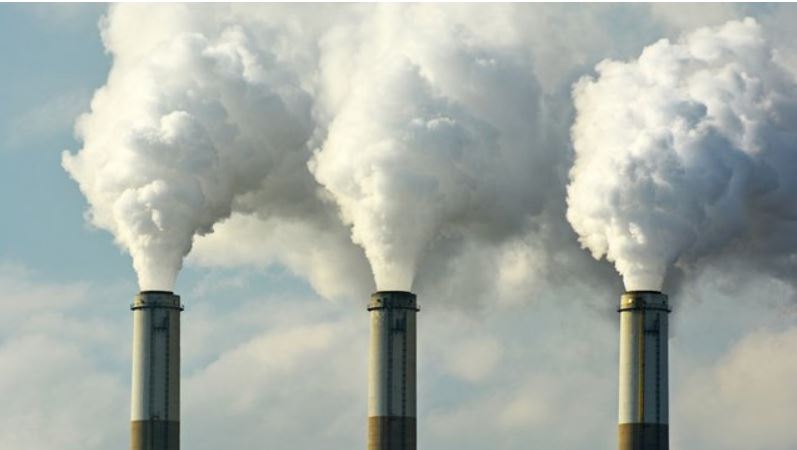
New daily, monthly and all-time record highs were set across the country last week, with more than 100 million people sweating it out under heat warnings or advisories. But the low nighttime temperatures that usually provide a crucial respite from scorching summer days have been more quietly making history.

On July 2, Burlington, Vt., set a record for its hottest overnight temperature as the thermometer refused to budge below 80 degrees Fahrenheit. Four days later, central Los Angeles hit 95 degrees before 11 a.m., already breaking the previous daily record of 94 degrees, before rising to well over 100 in the afternoon.

More of the U.S. is Seeing Extremely Warm Temperatures at Night

Percentage of the United States in which local areas are experiencing
extreme minimum (nighttime) and maximum (daytime) summer temperatures

50% of United States area

50%

Extremely warm

nighttime lows

Extremely warm

daytime highs

40%

40%

30%

30%

20%

20%

10%

10%

1920

1940

1960

1980

2000

1920

1940

1960

1980

2000

Source: National Oceanic and Atmospheric Administration | NOAA defines extremely hot temperatures as those in the top 10 percent for the local period of record.
Nationwide, summer nights have warmed at nearly twice the rate of days, with overnight low temperatures increasing 1.4 degrees Fahrenheit per century since 1895, when national temperature records began, compared to a daytime high increase of 0.7 degrees per century. (Nights have warmed faster than days during other seasons, too.)

ADVERTISEMENT

That pattern, which is in keeping with climate change models, is expected to continue as the world warms because of human-caused carbon emissions.

Derek S. Arndt, chief of the climate monitoring division at the National Oceanic and Atmospheric Administration, called the increase in summer nighttime temperatures a “dramatic example” of how small shifts in average temperature can lead to big consequences in the extremes.

california.jpg
An early-July heatwave broke temperature records across Southern California. Mike Blake/Reuters
Warmer Summer Nights
Can ‘Really Be Lethal’
In a typical year, heat waves kill more Americans than any other natural disaster including floods, tornadoes and hurricanes.

While warm summer nights may seem less concerning than scorching afternoons, “the combination of high daytime and high nighttime temperatures can be really lethal because the body doesn’t have a chance to cool down during the nighttime hours,” said Lara Cushing, professor of environmental epidemiology at San Francisco State University.

Those risks are higher in places where temperatures have historically been cooler, like coastal California. There people are less physiologically acclimated (the body can get used to higher temperatures up to a point) and less behaviorally adapted to hot weather.

“A hundred and five degrees in San Francisco is going to have a bigger impact probably than 105 degrees in Houston, Tex., where everybody has air conditioning and people are accustomed to dealing with high temperatures,” Dr. Cushing said.

Older people, the sick, and young children are especially at risk. So are agricultural, construction and other outdoor workers, who can no longer avoid the heat by shifting their hours to work earlier or later in the day. Similarly, homeless people who bear the full brunt of the elements get little relief.

ADVERTISEMENT

In cities like Los Angeles, Asian-American, black, and Hispanic residents are more likely to live in hotter parts of the city than white residents because of a complicated range of factors like green spaces, elevation, prevailing winds and proximity to the ocean. Lack of green spaces in some neighborhoods, for example, can exacerbate the heat island effect, a phenomenon in which cities are as much as 22 degrees Fahrenheit warmer than less built-up environments because of of their impervious, heat-absorbing surfaces.

While air conditioning can provide a respite from intense heat, it isn’t a panacea. Air conditioners work by sending hot air outside, adding to the heat island effect. If fossil fuels are used to provide power for air conditioners, it exacerbates climate change. And, increased air conditioner use taxes electrical grids making power failures more likely. In the midst of the recent heatwave, roughly 90,000 Los Angeles area residents lost power because transformers, which help distribute electricity, overheated and failed.

Health officials in Canada estimated that up to 70 people in Quebec may have died from heat-related causes after last week’s heat wave stretched north.

Posted on

Fed Up With Climate Change, Trees Are Moving North & West

Fed Up With Climate Change, Trees Are Moving North & West

USA TODAY – Doyle Rice – May 18, 2017

It’s getting so hot that even the trees are heading north. Man-made climate change — including warmer temperatures and deviations in rainfall patterns — appears to be one of the reasons tree populations in the eastern U.S. are shifting north and, more surprisingly, west, according to new research.

The shift could even lead to the extinction of certain trees in select forests, the study said.

Overall, the changing climate has pushed trees an average of 20 miles north and 25 miles west over the past 30 years. While the northern shift was expected due to warming temperatures, researchers think the more surprising westward movement could be the result of a change in rainfall patterns.

When researchers analyzed the impact of climate change, they found precipitation had a stronger impact on forests in the short term than temperatures, said lead author Songlin Fei of Purdue University.

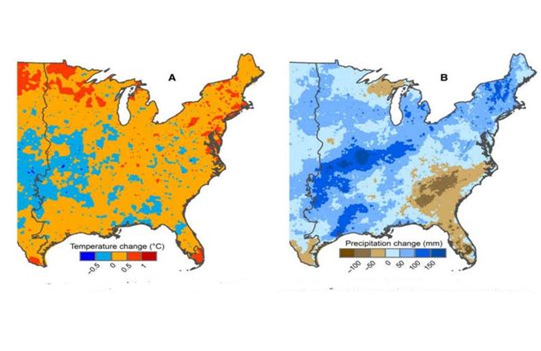
The eastern U.S. has gotten warmer over the past few decades, and the Southeast has been trending drier.

Fei said that deciduous trees like oak and maple are primarily moving west, and evergreens are moving north. While trees don’t move, of course, where they sprout can change. Saplings can expand into a new region while older growth dies in another, The Atlantic reported.


Left: Changes in temperature across the eastern U.S. between the recent past (1951–1980) and the study period (1981–2014). Yellow and red areas have warmed, while blue areas have cooled. Right: Changes in precipitation. Blue areas have gotten wetter and brown areas have gotten drier.

One of the more striking examples is the scarlet oak, which in nearly three decades has moved more than 127 miles northwest from the Appalachians, Fei told the Associated Press. Today, its population is reduced in the Southeast and more popular in the Midwest.

“Management actions to increase forest ecosystems’ resilience to climate change should consider the changes in both temperature and precipitation,” the study advised.

Brent Sohngen of Ohio State University, who was not involved in the study, told the AP the findings show “there is no doubt some signature of climate change.” But he added that given the rapid rates of change reported, harvesting, forest fires and other disturbances are probably still playing a more significant role than climate change.

The research, which studied 86 species of trees and was based on the analysis of three decades of data gathered by the U.S. Forest Service, was published in the peer-reviewed journal Science Advances.

Posted on

Washington county files lawsuit against oil and gas industry over climate change

Washington county files lawsuit against oil and gas industry over climate change

A Washington state county filed a lawsuit against the oil and gas industry Thursday for contributing to climate change.

King County’s suit is targeting five fossil fuel companies — BP, Chevron, Exxon Mobil, Royal Dutch and ConocoPhillips — “for knowingly contributing to climate disruptions and putting the residents of King County at greater risk of floods, landslides, ocean acidification, sea level rise, and other impacts,” according to a county statement.

The county, which encompasses Seattle, aims to require those companies to establish an abatement fund to mitigate the effects of climate change on salmon recovery, public health, storm water management and infrastructure.

“The science is undisputable [sic]: climate change is impacting our region today, and it will only cause greater havoc and hardships in the future,” King County Executive Dow Constantine said in a statement.

“The companies that profited the most from fossil fuels should help bear the costs of managing these disasters. Big Oil spent many decades disregarding and dismissing what is our most pressing generational challenge. We must hold these companies accountable as we marshal our resources to protect and preserve what makes this region great.”

The county adds its name to other districts in California, New York and Colorado that have filed similar lawsuits.

On May 24, the U.S. District Court for the Northern District of California will start hearings on whether a suit filed by San Francisco and Oakland should proceed to trial or be dismissed. A similar hearing will take place in New York City in June.

Environmentalist groups are cheering the latest suit. 

Richard Wiles, executive director for the Center for Climate Integrity, called it a “moment of reckoning.”

“The fossil fuel industry is not above the law: oil and gas is a product just like lead, asbestos, and tobacco, where producers can be held liable for damages,” he said in a statement.

But fossil fuel and manufacturing industries are criticizing the suits as baseless targeting.

“Lawsuits targeting manufacturers do nothing to address climate change, but will do plenty to line the pockets of plaintiffs’ attorneys — and in this case, the very same attorneys behind countless other public nuisance lawsuits throughout the country,” said Lindsey de la Torre, executive director of the Manufacturers’ Accountability Project in a statement.

“As history has demonstrated, these lawsuits stand little chance in the courtroom.”

Posted on

Precipitation whiplash and climate change threaten California’s freshwater


National 

Precipitation whiplash
and climate change threaten
California’s freshwater

Almost two-thirds of California’s freshwater originate in the Sierra Nevada mountains. But the source is in trouble.


Imagine the snow in the Sierra Nevada mountains as a giant reservoir providing water for 23 million people throughout California. During droughts, this snow reserve shrinks, affecting water availability in the state.

Snow extent on April 1

Redding

Sacramento

San Francisco

Los Angeles

San Diego

Researchers fear global warming will cause the Sierra Nevada snowpack to lose much of its freshwater by the end of the century, spelling trouble for water management throughout the state.

The California Department of Water Resources found last month that the water content in the Sierra snowpack was about half its historical average for the beginning of April despite late winter storms. One year before, the water content had been measured at over 160 percent of the historical average. This swing is not new and continues California’s recent trend of climate shifts, following the 2011-2015 drought.

Amount of water stored as snow

Less water

More water

2012

2013

2014

2015

2016

2017

2018

Below historical average

Above historical

average

Below historical

average

Scientists from the University of California, Los Angeles (UCLA) expect to see an increase in ‘precipitation whiplash’ events in the region, with rapid transitions between extreme wet and extreme dry periods.

These extreme precipitation events pose a risk to dams, levees and canals, few of which have been tested against intense storms such as those that caused the Great Flood of 1862. By the end of the 21st century, the frequency of floods of this magnitude across the state is expected to increase by 300 to 400 percent.

subscribe
The story must be told.
Your subscription supports journalism that matters.

Dams are at risk

During the winter of 2017, record snowfall in the Sierras caused a spillway to fail on the Oroville Dam, sending water spilling over the dam. Nearly 190,000 residents were forced to evacuate their homes. The man-made lake is the linchpin of California’s government-run water delivery system. It provides water for agriculture in the Central Valley and for homes and businesses in Southern California.

After the damage to the dam’s spillways, DigitalGlobe, a satellite imagery company, released images showing the extent of the damage.

August 2016

February 14, 2017

Lake

Oroville

Lake

Oroville

After torrential winter storms, water poured over the lake’s spillways, severely damaging them.

Emergency

spillway

Emergency

spillway

Low

water level

Overflow

damage

Melting brings trouble

Scientists from UCLA’s Institute of the Environment and Sustainability and the Center for Climate Science predicted increased warming in the region will cause snow to melt faster. Also, more of the precipitation will fall as rain rather than snow.

Currently, half of the total water in the Sierra reservoir runs off by May. If greenhouse gases are not mitigated, by the end of the century we will see the water reserve halved 50 days earlier. This could pose problems in managing water in the reservoir system, which serves a dual purpose: it stores water for use in dry seasons, but also protects downstream communities against flooding.

Half of the total water stored in the snowpack is projected to run off 50 days earlier by the end of the century.

Measured runoff

1981-2000

Projected runoff

2081-2100

Jan.

Feb.

March

April

Runoff

midpoint

May

June

July

Aug.

Dec.

Water from precipitation is stored throughout the year.

The future of snowpack in the Sierras

If the pace of global warming remains unchanged, there will be 64 percent less snow in the Sierra by the end of the century, scientists said.

If the global community takes measures to curb climate change in line with the 2015 Paris Climate Agreement the loss in average springtime snowpack volume would be 30 percent.

Water content in the Sierra snowpack under different scenarios


1,000 mm snow water equivalent

No climate change

2016-2017 winter

800


600

Greenhouse gas

emissions reduced


400

200

Greenhouse gas emissions not

reduced by end of century


Posted on

Change in Urban/Community Tree Cover by State

https://www.nrs.fs.fed.us/news/release/resources/cities-communities-losing-tree-cover/

You are here: NRS Home / News / Cities and Communities in the U.S. Losing 36 Million Trees a Year / State by state summary of change in community tree cover

Publications & Data

Change in Urban/Community Tree Cover by State


Year 1

Year 2

Change between years

State Years

%

SE

%

SE

%a

%/yrb

Acres/yrc

Alabama (2007-2014)

51.7

1.6

49.7

1.6

-2.0*

-0.32

-12,890

Alaska (2006-2012)

48.8

2.3

48.8

2.3

0.0

0.00

0

Arizona (2008-2014)

30.8

1.5

30.2

1.5

-0.6

-0.11

-6,190

Arkansas (2009-2013)

47.3

1.6

46.9

1.6

-0.4

-0.08

-1,430

California (2009-2014)

39.4

1.5

39.0

1.5

-0.4

-0.08

-7,890

Colorado (2007-2013)

21.8

1.3

21.6

1.3

-0.2

-0.03

-610

Connecticut (2008-2014)

63.0

1.5

62.7

1.5

-0.3

-0.05

-640

Delaware (2006-2011)

35.8

1.5

35.3

1.5

-0.5

-0.10

-290

District of Columbia (2010-2015)

36.1

1.5

33.9

1.5

-2.2*

-0.44

-170

Florida (2009-2014)

49.0

1.6

47.6

1.6

-1.4*

-0.26

-18,060

Georgia (2009-2014)

63.4

1.5

61.4

1.5

-2.0*

-0.40

-18,830

Hawaii (2010-2015)

50.2

1.6

50.1

1.6

-0.1

-0.02

-150

Idaho (2008-2014)

14.2

1.1

13.8

1.1

-0.4

-0.07

-420

Illinois (2008-2013)

30.9

1.5

29.9

1.4

-1.0*

-0.20

-6,910

Indiana (2008-2013)

30.8

1.5

30.1

1.5

-0.7*

-0.13

-2,790

Iowa (2008-2013)

21.9

1.3

20.9

1.3

-1.0*

-0.20

-2,870

Kansas (2009-2014)

31.0

1.5

30.3

1.5

-0.7*

-0.13

-1,450

Kentucky (2008-2014)

39.8

1.5

38.9

1.5

-0.9*

-0.16

-2,500

Louisiana (2009-2014)

47.6

1.6

47.3

1.6

-0.3

-0.06

-1,330

Maine (2008-2013)

68.4

1.5

68.1

1.5

-0.3

-0.06

-510

Maryland (2009-2014)

53.4

1.6

53.1

1.6

-0.3

-0.06

-1,020

Massachusetts (2008-2014)

59.7

1.6

58.4

1.6

-1.3*

-0.23

-4,930

Michigan (2008-2014)

46.7

1.6

45.9

1.6

-0.8*

-0.13

-3,810

Minnesota (2009-2014)

46.7

1.6

46.7

1.6

0.0

0.00

0

Mississippi (2009-2014)

52.4

1.6

52.7

1.6

0.3

0.06

1,000

Missouri (2010-2015)

40.1

1.5

39.7

1.5

-0.4

-0.08

-1,860

Montana (2009-2014)

37.1

1.5

37.2

1.5

0.1

0.02

470

Nebraska (2009-2014)

20.4

1.3

18.8

1.2

-1.6*

-0.32

-1,800

Nevada (2009-2014)

27.0

1.4

26.8

1.4

-0.2

-0.04

-900

New Hampshire (2009-2015)

64.4

1.5

63.0

1.5

-1.4*

-0.25

-1,650

New Jersey (2008-2013)

48.4

1.6

47.8

1.6

-0.6*

-0.12

-2,590

New Mexico (2010-2015)

21.9

1.3

22.1

1.3

0.2

0.04

790

New York (2008-2013)

53.4

1.6

52.4

1.6

-1.0*

-0.19

-6,720

North Carolina (2010-2015)

54.8

1.6

54.2

1.6

-0.6

-0.11

-4,510

North Dakota (2009-2013)

10.7

1.0

10.1

1.0

-0.6

-0.13

-590

Ohio (2009-2014)

39.2

1.5

38.2

1.5

-1.0*

-0.20

-7,230

Oklahoma (2009-2014)

35.6

1.5

34.0

1.5

-1.6*

-0.30

-9,710

Oregon (2008-2014)

35.6

1.5

33.9

1.5

-1.7*

-0.30

-3,450

Pennsylvania (2007-2013)

46.8

1.6

46.2

1.6

-0.6

-0.11

-4,320

Rhode Island (2010-2015)

54.5

1.6

52.3

1.6

-2.2*

-0.44

-1,260

South Carolina (2009-2014)

54.8

1.6

53.6

1.6

-1.2

-0.23

-5,190

South Dakota (2008-2014)

13.9

1.1

13.6

1.1

-0.3

-0.05

-280

Tennessee (2008-2013)

48.4

1.6

46.9

1.6

-1.5*

-0.27

-9,060

Texas (2009-2015)

28.9

1.4

28.3

1.4

-0.6*

-0.11

-10,180

Utah (2010-2015)

16.7

1.2

16.6

1.2

-0.1

-0.02

-360

Vermont (2010-2015)

57.5

1.6

56.6

1.6

-0.9*

-0.18

-370

Virginia (2009-2014)

51.5

1.6

51.0

1.6

-0.5

-0.10

-2,970

Washington (2009-2014)

42.3

1.6

41.6

1.6

-0.7

-0.14

-3,350

West Virginia (2008-2014)

61.9

1.5

61.3

1.5

-0.6

-0.11

-790

Wisconsin (2009-2014)

38.8

1.5

38.3

1.5

-0.5*

-0.10

-2,340

Wyoming (2009-2014)

15.8

1.2

15.8

1.2

0.0

0.00

0

Total US (2009-2014)

42.9

0.4

42.2

0.4

-0.7*

-0.12

-174,940


Footnotes:

a Change in percent tree cover between years.
b Annualized change in percent tree cover between years.
c Annualized change in tree cover (in acres) between years.
* Statistically significant change at alpha = 0.05.

Source:
Nowak, David J.; Greenfield, Eric J. 2018. Declining urban and community tree cover in the United States. Urban Forestry & Urban Greening. 32: 32-55. https://doi.org/10.1016/j.ufug.2018.03.006.


For additional information, please contact David Nowak.

Posted on

How Big Forests Solve Global Problems

Op-Ed Contributors

How Big Forests Solve Global Problems

By Thomas E. Lovejoy and John Reid

Mr. Reid has pioneered the use of economic insights to conserve forests and other ecosystems globally. Mr. Lovejoy has worked in the Amazon (the largest tropical forest) since 1965.

Image
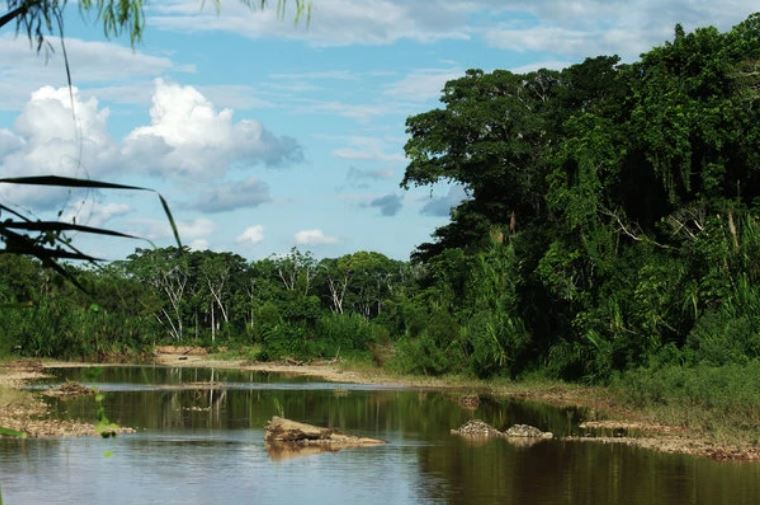
A tropical rainforest with a small river inside the heart of Madidi national park, Bolivia.CreditCreditTomas Zrna/Moment Open, via Getty Images

Sit on a log by the Madidi River in Bolivia at dusk and you can hear what an Amazon forest should sound like. The music includes red howler monkeys, breathy thumps from the mutum jungle fowl, droning cicadas, eerie calls locals attribute to deadly bushmaster vipers and the unhinged excitement of elusive titi monkeys. Around your feet, the beach is crisscrossed by jaguar tracks and those of the pony-size tapir, a shy beast that, if you keep quiet, will saunter out of the forest and swim across the river.

This is what scientists call an “intact forest landscape.” It’s a swath of at least 500 square kilometers (about 193 square miles, equal to 70,000 soccer fields) of unbroken forest. Because of their size, these areas have maintained all their native plant and animal life and biophysical processes. These forests still adorn parts of our planet’s tropical midsection, notably the Amazon, Congo Basin and the island of New Guinea. And they form a northern belt, the boreal forests of Canada, Russia, Alaska and Scandinavia.

Intact forests today total around 11.8 million square kilometers (about 4.6 million square miles), according to estimates by a group of researchers and organizations, including Greenpeace, Global Forest Watch, World Resources Institute, Transparent World, University of Maryland, World Wildlife Fund of Russia and Wildlife Conservation Society. That’s roughly the United States and Mexico combined. It’s about a quarter of the planet’s total forest area, the rest of which is fragmented by roads, mines, cities and agriculture. Over 7 percent has been lost since 2000. Keeping the rest is a key to turning around three stubborn global trends: climate change, the sixth great extinction crisis and the loss of human cultures.

In the tropics, intact forests hold 40 percent of the aboveground forest carbon even though they make up only 20 of those latitudes’ forests. And intact forests have been shown recently to absorb enough carbon to offset many Amazon countries’ (like Peru) total emissions. When forests become fragmented, edge effects (forest damage at created edges), drying and fire cause over 150 million tons of annual emissions — more than result from outright deforestation.

The United States Environmental Protection Agency estimates suggest that those emissions cost us $6.3 billion in lost crops, flood damage, fires and other impacts. In the boreal region, forests protect permafrost, which, if it thaws, will be a huge source of heat-trapping methane emissions. Aside from maintaining the global climate, intact forests stabilize weather locally and regionally, which sustains livelihoods for millions of people.

Carbon has been fashioned by evolution into a staggering array of plants and animals, many of which are threatened by the current spasm of extinctions. The great intact forests host the most diverse ecosystems and robust populations of top predators, wide-ranging migrants and undiscovered species. They are evolutionary workshops still going full tilt. In places like the western Amazon, intact forests climb mountainsides, giving species altitudinal ladders to survive climate change.

The planet’s cultural diversity also depends on its big forests. Of the world’s approximately 6,900 languages, around a quarter are from the three great tropical forest regions (which have just 6 percent of the land area): 330 languages in the Amazon, 1,100 in New Guinea and its environs and 242 in the Democratic Republic of Congo, where most of Africa’s intact forests are. Unesco estimates that a language is lost every two weeks. Many are blinking out as the forests that sustain their speakers are eroded.

Humanity’s very ability to think certain thoughts depends on our great forests. When the renowned Harvard botanist Richard Evans Schultes first arrived in the Amazon (in 1941), he found that some Indians used the same word for “green” and “blue” but had 18 terms for varieties of a sacred vine that had been identified by baffled scientists as a single species.

Forest conservation solutions are practical and affordable. First, roads need to give big forests a wide berth. The principal underlying driver of fragmentation is road-building, which carves forests into progressively smaller patches and has accounted for 81 percent of losses since 2000. And they usually lose money. One study found that a major new highway in the Brazilian Amazon would return around 6.5 cents on each dollar of investment. Money is better spent by intensifying transportation near towns and existing farms, where the infrastructure can serve more people. A 2014 global study in Nature showed that needed road networks could be developed without fragmenting forests.

Second, forest peoples’ land rights need to be supported, for both ethical and practical reasons. There are almost no forests without people; intact forest wildernesses are forests with few people whose traditions and economies are woven into the landscape. Recent Amazon research shows that legally recognized indigenous territories are extremely effective at preventing deforestation, even where deforestation pressure is high. Parks and nature reserves were also revealed to be effective, especially when tailored to local needs.

Third, the adage that you can’t manage what you don’t measure applies here. A continuous, near-real-time system of monitoring must be put in place to track where intact forests are being cut so that governments, forest communities and private organizations can react early.

How will we pay for a future with forest wilderness? Part of the answer lies in programs to avert climate change. A recent economic study indicates that a large share of intact forests could be preserved at a cost of $20 per ton of carbon. That’s less than half of one indicative benchmark figure: the $52 midpoint price projected by California for its regulated carbon emissions market in 2030.

But for funds to flow, climate policies need to adapt. They now provide little incentive to conserve large, often remote forest areas. That’s because the forests are beyond the immediate frontier of expanding agriculture and therefore not recognized by climate protection regimes as targets for campaigns to avoid deforestation. It’s difficult to project the baselines of intact forest loss and degradation far into the future, and those predictions are needed to calculate the climate benefits of protecting them. But the United Nations Green Climate Fund and forested countries and donors should embrace that challenge and fill the funding gap.

It takes four days and a balsa wood raft to get to that beach in the Bolivian Amazon, which is a big part of the reason its big trees are still standing. Similarly epic journeys will get you to forest gems around the world, where, if you listen, you’ll understand a little more about where we came from and where we need to go from here.


Thomas E. Lovejoy is a professor of environmental science and policy at George Mason University. John Reid is the founder and former president of Conservation Strategy Fund and advises Nia Tero and the Field Museum in Chicago on economic and policy dimensions of protecting natural ecosystems and indigenous territories.

Follow The New York Times Opinion section on Facebook and Twitter (@NYTopinion), and sign up for the Opinion Today newsletter.